How to Observe and Recover the Runtime
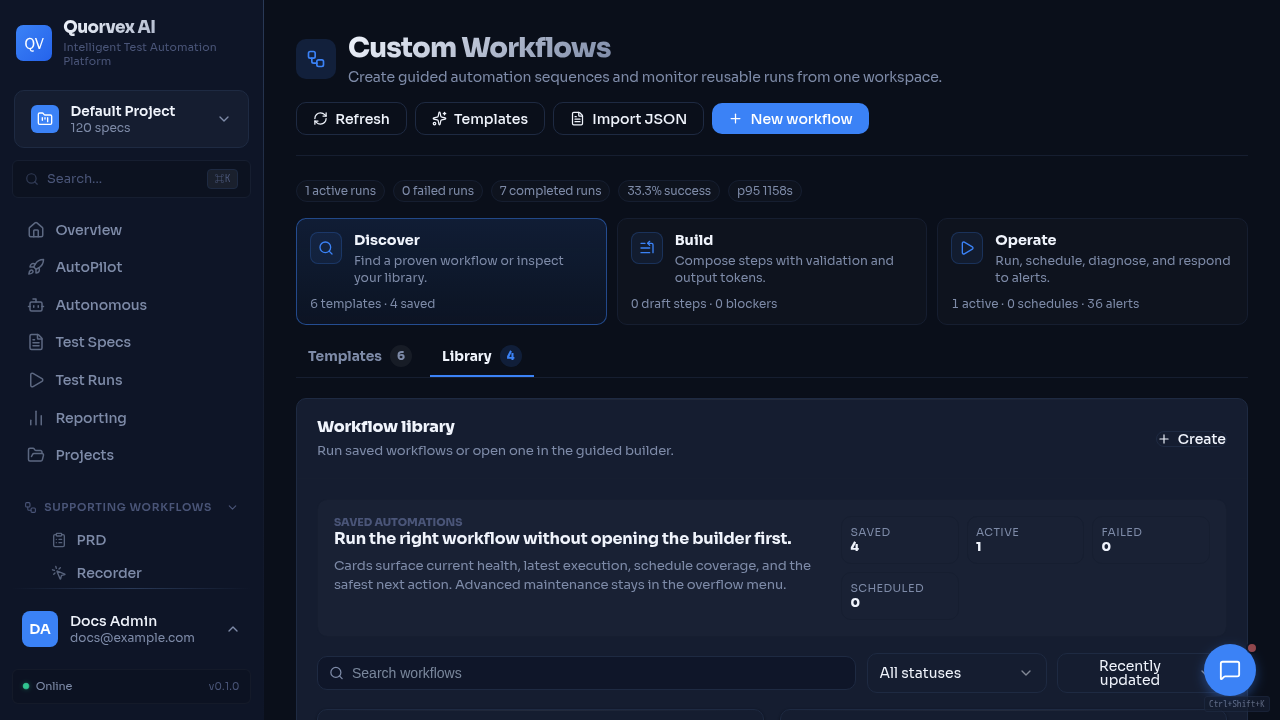
Workflow monitor showing runtime diagnostics and recovery context.
How to diagnose backend runtime state and recover common stuck work without guessing.
Prerequisites
- The backend is running.
- You can access the dashboard or call the API.
- You have shell access for Makefile and Docker commands when using a containerized setup.
Step 1: Check Service Health
Start with health endpoints before looking at individual jobs.
Use storage health when runs, artifacts, backups, or MinIO-backed data look inconsistent.
Step 2: Check Run Queue State
Use the queue status endpoint to see active, queued, and orphaned core test runs.
Look for:
- high queued count with no active workers
- orphaned running count
- orphaned queued count
- browser pool saturation
The backend also runs watchdog cleanup, but the endpoint gives immediate state during an incident.
Step 3: Inspect Browser Pool State
Browser pool endpoints show active slots, recent slot history, and stale resources.
curl http://localhost:8001/api/browser-pool/status
curl http://localhost:8001/api/browser-pool/recent?limit=20
If slots are stale and no work is actually running, force cleanup:
Step 4: Check Agent Queue State
Agent queue issues usually affect autonomous missions, custom agent work, or long-running assistant-style tasks.
If the queue contains stale running tasks from dead workers, clean orphaned tasks:
Use queue flush only when you intentionally want to cancel queued work and fail running work:
Step 5: Review Logs
For Docker-based setups:
For local development, inspect the backend terminal and generated run directories under runs/.
Useful log themes:
| Theme | Meaning |
|---|---|
| startup diagnostics | configuration and capacity detected at boot |
| orphan cleanup | previous process or worker left state behind |
| browser pool cleanup | stale browser slots were released |
| scheduler reconciliation | missed or stale scheduled executions were processed |
| Temporal unavailable | durable workflow backend is not reachable |
| Redis unavailable | distributed queue behavior is degraded |
Step 6: Reconcile Scheduled Work
If schedules or workflow schedules stop firing, restart the backend after checking logs. Startup initializes the scheduler and reconciles workflow schedule executions.
In production-style Docker mode:
Step 7: Recover Stuck Work
| Symptom | Recovery path |
|---|---|
| Run appears running but no process exists | Check /queue-status; watchdog or queue cleanup should mark it stopped |
| Browser capacity stuck at max | Check browser pool status, then POST /api/browser-pool/cleanup |
| Agent task stuck after worker restart | POST /api/agents/queue-clean-orphans |
| Many queued agent tasks are no longer wanted | POST /api/agents/queue-flush |
| K6 distributed run is not progressing | Check K6 worker logs and Redis connectivity; restart K6 workers |
| Scheduled workflow missed a run | Restart backend to trigger schedule reconciliation, then inspect workflow events |
| Artifacts are missing | Check /health/storage, run directory, and MinIO configuration |
Verification
After recovery:
curl http://localhost:8001/healthreturns healthy status./queue-statusdoes not report unexpected orphaned runs.- Browser pool active slots match actual running work.
- New test run can start and finish.
- Dashboard pages load current status without stale pending work.